USB-C Cable Voltage Drop and Power Loss: Complete Engineering Guide 2026
Every engineer and product designer working with USB-C Cable power delivery systems needs to understand voltage drop and power loss — two phenomena that directly determine whether your device charges efficiently or struggles with slow charging, overheating, or power negotiation failures. Eilinks Electronics, a precision USB-C cable manufacturer, provides this comprehensive engineering guide.
The Physics of Voltage Drop in USB-C Cables
Voltage drop occurs because all copper conductors have electrical resistance. When current flows through this resistance, a voltage difference appears between the source end and the load end of the cable. This is governed by Ohm’s Law:
For a USB-C Cable carrying 5A at 20V (100W), even a cable with 100mΩ round-trip resistance will lose 0.5V — delivering only 19.5V to the device. At full 5A current, this represents 2.5W of heat dissipated in the cable itself.
Resistance Factors in USB-C Cable Design
Conductor Cross-Section (AWG)
The most important determinant of cable resistance is conductor wire gauge. The American Wire Gauge (AWG) system uses inverse numbering — lower AWG = thicker wire = lower resistance.
| AWG | Conductor Diameter (mm) | Resistance (Ω/m, single conductor) | Max Current (A) |
|---|---|---|---|
| 28 AWG | 0.321 | 0.213 | 0.5 |
| 26 AWG | 0.405 | 0.134 | 1.0 |
| 24 AWG | 0.511 | 0.084 | 2.0 |
| 22 AWG | 0.644 | 0.053 | 3.0 |
| 20 AWG | 0.812 | 0.033 | 5.0 |
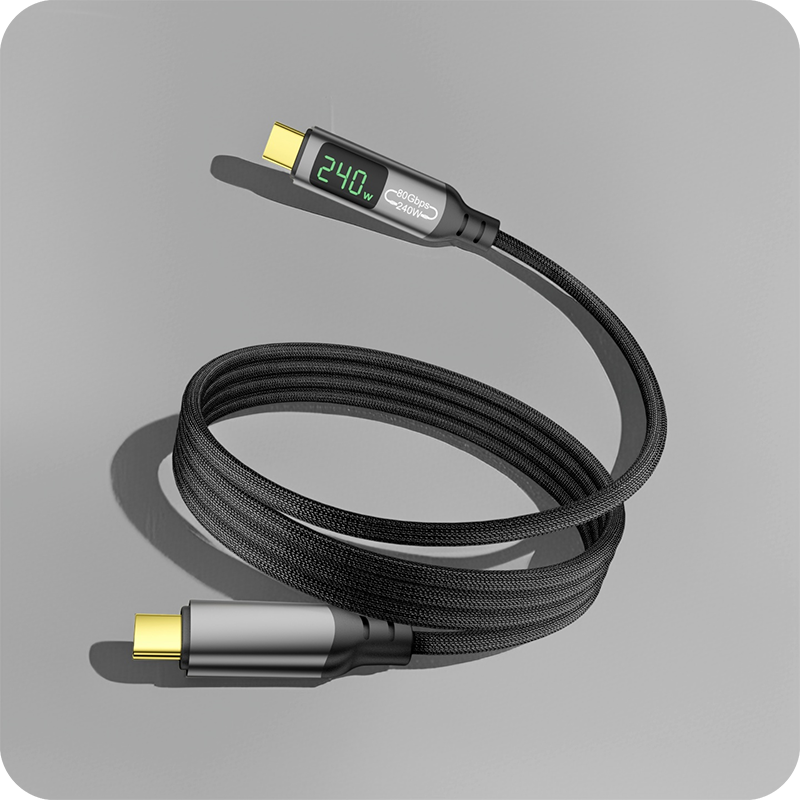
A high-power USB-C Cable rated for 240W USB-C EPR operation uses 20 AWG VBUS and GND conductors. The USB Power Delivery specification requires that the total cable DC resistance (VBUS + GND) must not exceed 300mΩ for cables up to 2m.
Cable Length
Resistance scales linearly with length. A 2m cable has twice the resistance of a 1m cable. For a 20 AWG conductor at 2m, the round-trip (VBUS + GND) resistance is approximately:
Contact Resistance
The USB-C connector pins contribute additional resistance — typically 10–30mΩ per contact pair when new, rising to 50–100mΩ after extensive use or in corroded environments. Eilinks Electronics uses gold-plated contacts (0.2µm flash gold over nickel) to minimize contact resistance throughout the cable’s rated insertion cycle life (10,000 cycles).
USB PD Voltage Drop Limits and Compliance
The USB Power Delivery specification defines explicit maximum cable resistance requirements that protect both the cable and connected devices:
| USB PD Spec | Max Power | Max Cable Resistance | Max Allowed V_drop at Full Current |
|---|---|---|---|
| USB PD 2.0 (5A) | 100W | 300mΩ (full cable) | 1.5V at 5A |
| USB PD 3.1 SPR (5A) | 140W (28V×5A) | 300mΩ | 1.5V at 5A |
| USB PD 3.1 EPR (5A) | 240W (48V×5A) | 300mΩ | 1.5V at 5A |
The E-Marker chip in a certified USB-C Cable reports the cable’s rated current capability to the charger and device. This enables the USB PD controller to calculate the expected voltage drop and compensate with Output Voltage Correction (OVC) — adjusting the charger’s output voltage upward to deliver the target voltage at the device.
Power Loss Calculation Examples
Scenario 1: Laptop Charging at 65W
A 1m USB-C cable with 24 AWG conductors (round-trip resistance ~168mΩ) carrying 3.25A at 20V:
- V_drop = 3.25A × 0.168Ω = 0.546V
- Device receives: 20V − 0.546V = 19.45V
- Power delivered: 19.45V × 3.25A = 63.2W
- Cable power loss: 65W − 63.2W = 1.8W (heat in cable)
Scenario 2: EPR Charging at 240W
A 2m EPR-rated USB-C Cable with 20 AWG conductors (round-trip resistance ~132mΩ) carrying 5A at 48V:
- V_drop = 5A × 0.132Ω = 0.66V
- Device receives: 48V − 0.66V = 47.34V
- Power delivered: 47.34V × 5A = 236.7W
- Cable power loss: 240W − 236.7W = 3.3W (heat in cable)
- Cable efficiency: 236.7/240 = 98.6%
This illustrates why 240W USB-C EPR cables run noticeably warm under full load — 3.3W of continuous heat dissipation from a cable the diameter of a pencil.
Scenario 3: Long Cable at Low Power
A 3m cable with 26 AWG conductors (round-trip resistance ~804mΩ) carrying 1A at 5V (5W mobile phone charging):
- V_drop = 1A × 0.804Ω = 0.804V
- Device receives: 5V − 0.804V = 4.196V
- This drops below the 4.45V minimum required for some fast-charging protocols
- Result: Device falls back to standard 5V/0.9A (4.5W) charging — significantly slower
Temperature and Voltage Drop Interaction
Copper resistance increases with temperature — approximately 0.4% per degree Celsius. A cable that’s already at the 300mΩ spec limit at 20°C will exceed it when operating at 70°C ambient temperature in a hot enclosed space, causing thermal runaway risk. Eilinks Electronics designs USB-C Cable products with 20–30% resistance margin below the spec limit to ensure safe operation across the full −20°C to +70°C operating range.
How to Measure Cable Resistance
Using a 4-Wire Kelvin Resistance Measurement
Standard 2-wire resistance measurements are inaccurate for low-resistance cables due to test lead resistance adding to the reading. Professional cable manufacturers like Eilinks Electronics use 4-wire Kelvin measurements to precisely characterize cable resistance to ±1mΩ accuracy.
In-Field Voltage Drop Testing
Connect a calibrated DC voltmeter between pin A4/B4 (VBUS) and pin A1/B1 (GND) at both ends of the cable while carrying full rated current. The difference in measured voltages equals the actual in-circuit voltage drop under real operating conditions.
Choosing Low-Resistance USB-C Cables
When selecting a USB-C Cable for high-power applications, prioritize:
- 20 AWG VBUS conductors for any cable intended for 60W+ power delivery
- E-Marker chip (mandatory for 5A cables) — confirms the cable is rated for full current
- Stated resistance spec — reputable cables like those from Eilinks Electronics publish their DC resistance values
- Cable length — for maximum charging speed, use the shortest cable that meets your needs
- Gold-plated contacts — minimize contact resistance degradation over thousands of insertions
Eilinks Electronics provides full electrical characterization data sheets for all USB-C Cable products, including DC resistance, insulation resistance, and impedance profiles — empowering engineers to make confident design decisions for their power delivery systems.